
Photo by Bruno Kelzer on Unsplash
Online Retail Exploratory Data Analysis with Python
Interpreting transactional data
Gaining some practice performing exploratory data analysis, since this is often one of the first steps in preparing data for machine learning.
Links:
Jupyter notebook
Tableau dashboard visualization
Here are some major steps
Load the dataset
Perform data cleaning by handling missing values, if any, and removing any redundant or unnecessary columns.
drop_duplicates(),df.dropna()Explore the basic statistics of the dataset
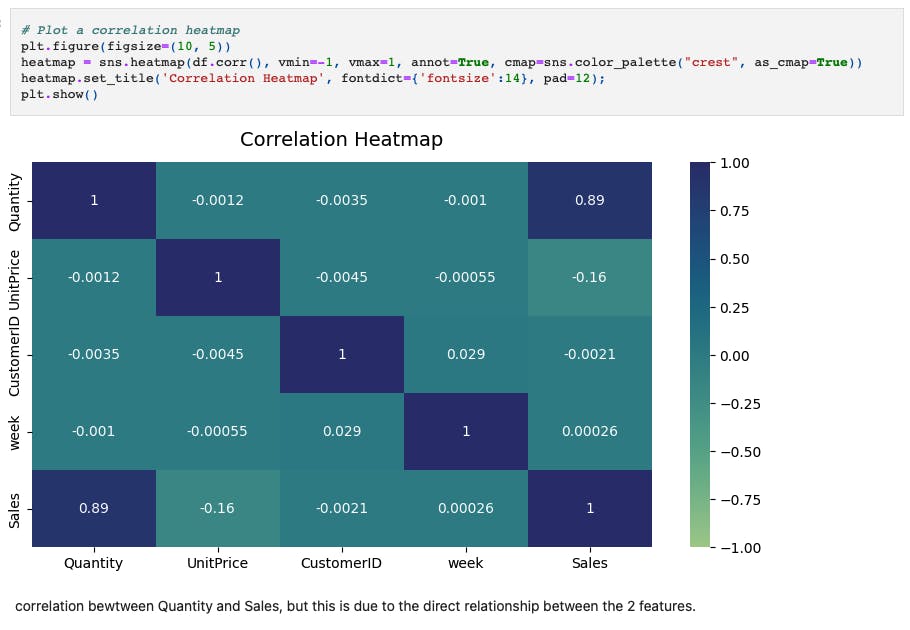
df.describe()Perform data visualization to gain insights into the dataset. Generate appropriate plots, such as histograms, scatter plots, or bar plots, to visualize different aspects of the data
Analyze the sales trends over time. Identify the busiest months and days of the week in terms of sales.
I used
groupby()to pivot the data for the sales trend charts.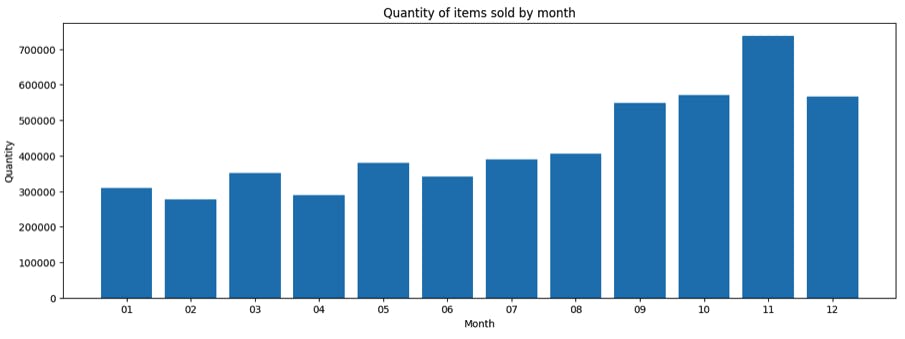
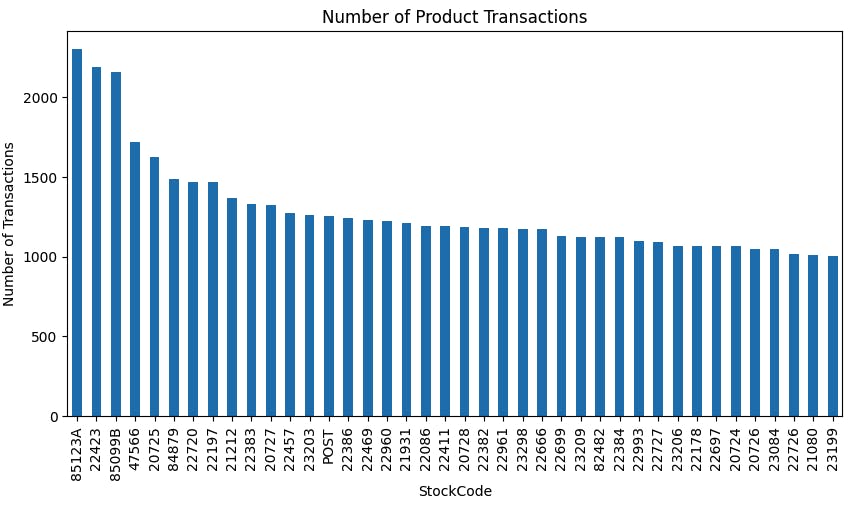
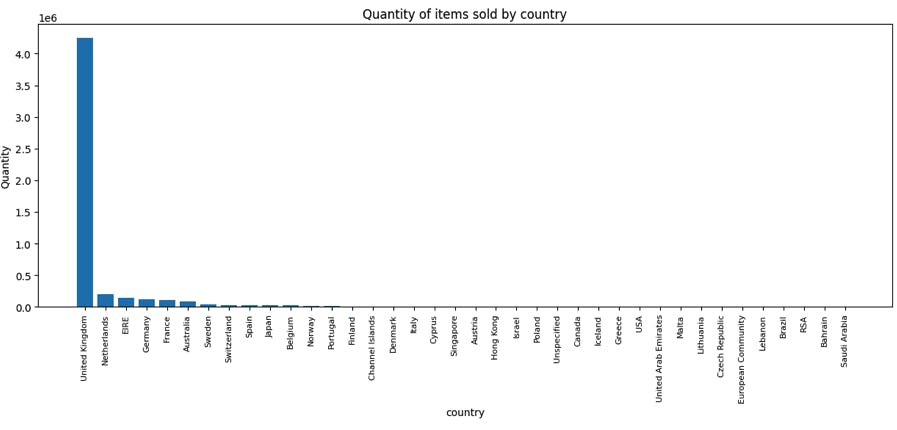
Explore the top-selling products and countries based on the quantity sold.
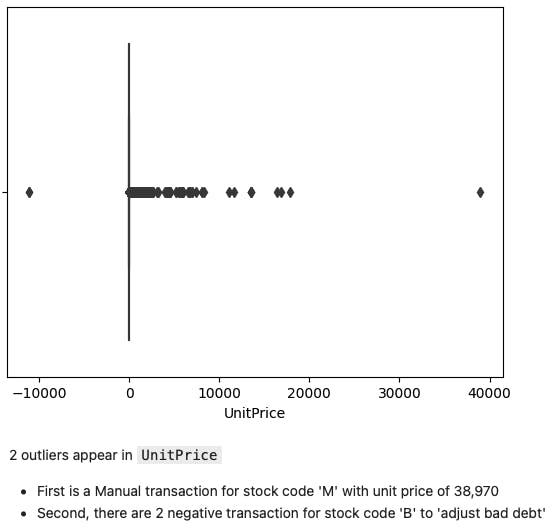
Identify any outliers or anomalies in the dataset and discuss their potential impact on the analysis.
Conclusions:
There are missing values for product
DescriptionandCustomerId, for now I will keep this in the data to discuss with customer before removing.There are some items in the transactions that might be removed. For example, items listed as AMAZON FEE, Manual, DOTCOM POSTAGE, and POSTAGE. This makes it harder to compare products sales in the data.
There appears to be 2 transactions with very high
Quantities, with the same quantity returned the same day. This appears to be returned items, recommend excluding these transactions.
2 outliers appear in UnitPrice
First is a Manual transaction for stock code 'M' with unit price of 38,970
Second, there are 2 negative transactions for
Stockcode'B' to 'adjust bad debt'
Until those items above are removed, we can see that:
📅Busiest month: November
📅Busiest weekday: Thursday
🔥Most transacted product qty: World War 2 Gliders Asstd Design (85123A)
Most transacted stockcode (without description): 22197
Highest unit price item: AMAZON FEE
Highest product unit price: REGENCY CAKESTAND 3 TIER
🌍Majority of sales are in United Kingdom
Avg transaction qty: 9.6
Avg transaction unit price: 4.6
Weekly qty has an upward trend in 2011

