Using interpolation to replace values in a dataframe.
I am an Industrial Engineer utilizing the power of python to gain deeper insights in data.
I am currently learning Deep learning with TensorFlow
When using some machine learning methods, replacing NaN values in a data frame is required. In my previous projects I utilized different methods like dropping the rows or columns with NaN .dropna(), or replacing them with zero or .mean().
While working a new project, those methods did not make sense when applied to the data, and I discovered using interpolation, .interpolate(), to approximate the missing values.
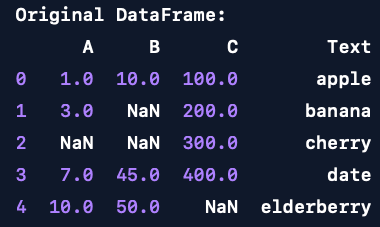
Here is a simplified example using a data frame that contains NaNs:
Original DataFrame:
      A     B      C        Text
0   1.0  10.0  100.0       apple
1   3.0   NaN  200.0      banana
2   NaN   NaN  300.0      cherry
3   7.0  45.0  400.0        date
4  10.0  50.0    NaN  elderberry
Replacing values in each column
Since the example has text and numeric values, I first separated each so I could apply the interpolation on the numeric columns only.
# Separate numeric and text columns
numeric_columns = df.select_dtypes(include=[np.number])
text_column = df['Text']

# Interpolate numeric columns
numeric_columns_interpolated = numeric_columns.interpolate(method='linear')

# Combine interpolated numeric columns with the text column
df_interpolated = pd.concat([numeric_columns_interpolated, text_column], axis=1)

# Display the DataFrame after interpolation
print("\nDataFrame after interpolation:")
print(df_interpolated)
DataFrame after interpolation:
      A          B      C        Text
0   1.0  10.000000  100.0       apple
1   3.0  21.666667  200.0      banana
2   5.0  33.333333  300.0      cherry
3   7.0  45.000000  400.0        date
4  10.0  50.000000  400.0  elderberry
Replacing values across rows
In my project I needed to replace the values across rows. To do this change the axis=1 parameter in the interpolation line.
# Interpolate numeric columns
numeric_columns_interpolated = numeric_columns.interpolate(method='linear', axis=1)

# Combine interpolated numeric columns with the text column
df_interpolated = pd.concat([numeric_columns_interpolated, text_column], axis=1)

# Display the DataFrame after interpolation
print("\nDataFrame after interpolation:")
print(df_interpolated)
DataFrame after interpolation:
      A      B      C        Text
0   1.0   10.0  100.0       apple
1   3.0  101.5  200.0      banana
2   NaN    NaN  300.0      cherry
3   7.0   45.0  400.0        date
4  10.0   50.0   50.0  elderberry
Notice there are still NaNs because the first column 'A' has NaN. This requires values in the first column to work. Replace the NaNs in the first column with zeros.
df['A'] = df['A'].fillna(0 ) # Replace the NaN in first column
df
DataFrame :
      A     B      C        Text
0   1.0  10.0  100.0       apple
1   3.0   NaN  200.0      banana
2   0.0   NaN  300.0      cherry
3   7.0  45.0  400.0        date
4  10.0  50.0    NaN  elderberry
Interpolate again
# Separate numeric and text columns
numeric_columns = df.select_dtypes(include=[np.number])
text_column = df['Text']

# Interpolate numeric columns
numeric_columns_interpolated = numeric_columns.interpolate(method='linear', axis=1)

# Combine interpolated numeric columns with the text column
df_interpolated = pd.concat([numeric_columns_interpolated, text_column], axis=1)

# Display the DataFrame after interpolation
print("\nDataFrame after interpolation:")
print(df_interpolated)
DataFrame after interpolation:
      A      B      C        Text
0   1.0   10.0  100.0       apple
1   3.0  101.5  200.0      banana
2   0.0  150.0  300.0      cherry
3   7.0   45.0  400.0        date
4  10.0   50.0   50.0  elderberry
Now I have a clean data frame I can use in my project.