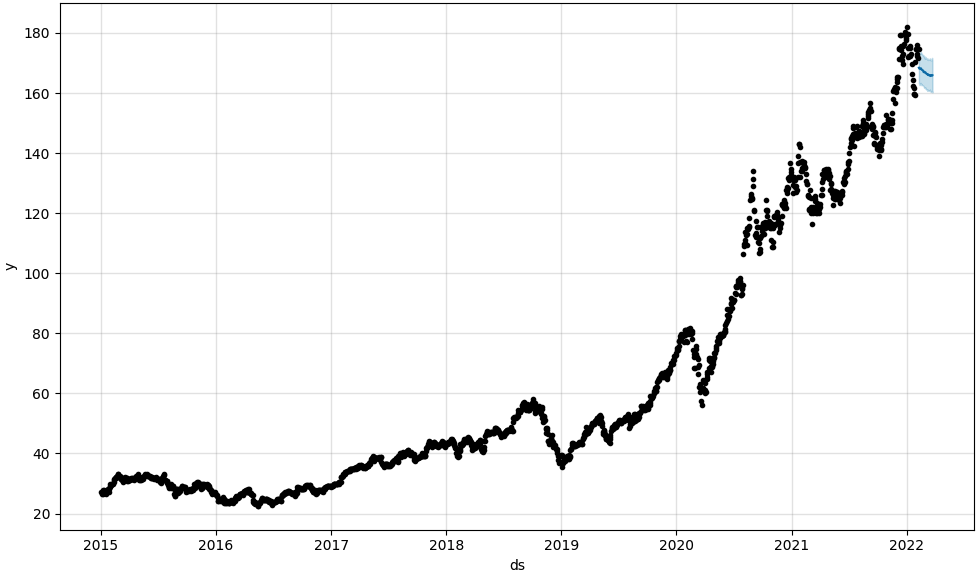
In this example, I am forecasting the future price of the AAPL stock, using data from the kaggle dataset starting with prices after 2015. View complete notebook here.
This model uses the Prophet library
from prophet import Prophet
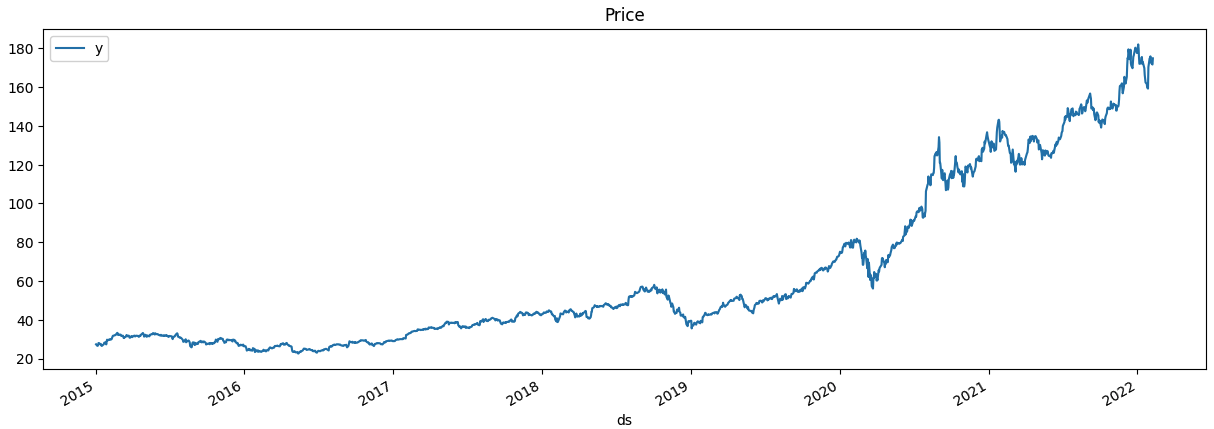
After importing the AAPL price data from csv, I created a graph of the price over time.
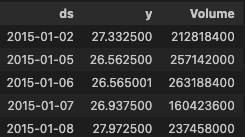
The dataset includes column for Volume each day, which I will use as a regressor in the prophet model
I trained it on the whole dataset, predicting for future data 31 days in the future.
›
# building the model
m = Prophet(
            seasonality_mode=sm,
            seasonality_prior_scale=sps,
            changepoint_prior_scale=cps)
m.add_regressor('Volume')
m.fit(training)
Creating predictions is pretty simple, just passing the future data frame.
# Forecasting
forecast = m.predict(future)
forecast.head(5)
Plotting the predictions
# Forecasting
forecast = m.predict(future_df)
m.plot(forecast);
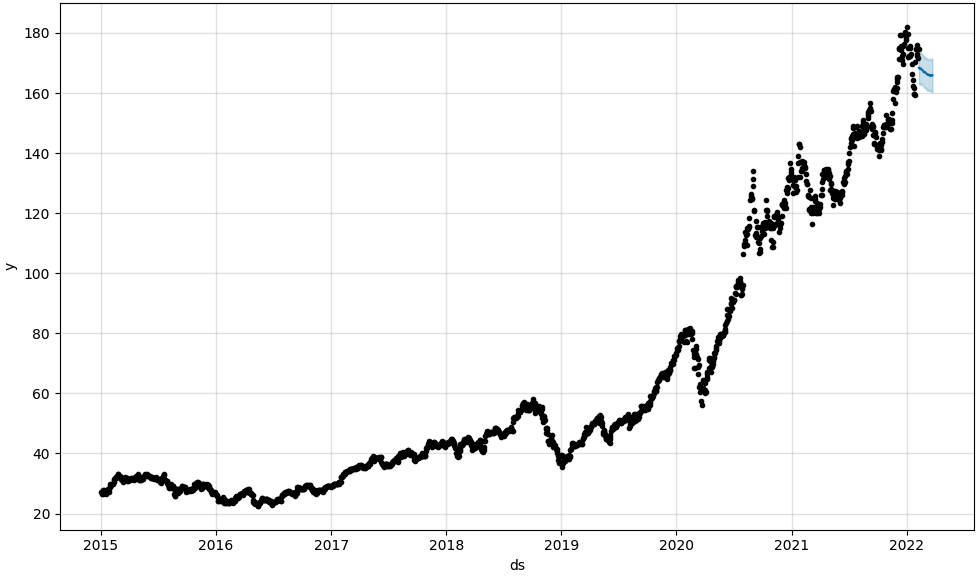
The model shows a downward trend for the next 31 days.
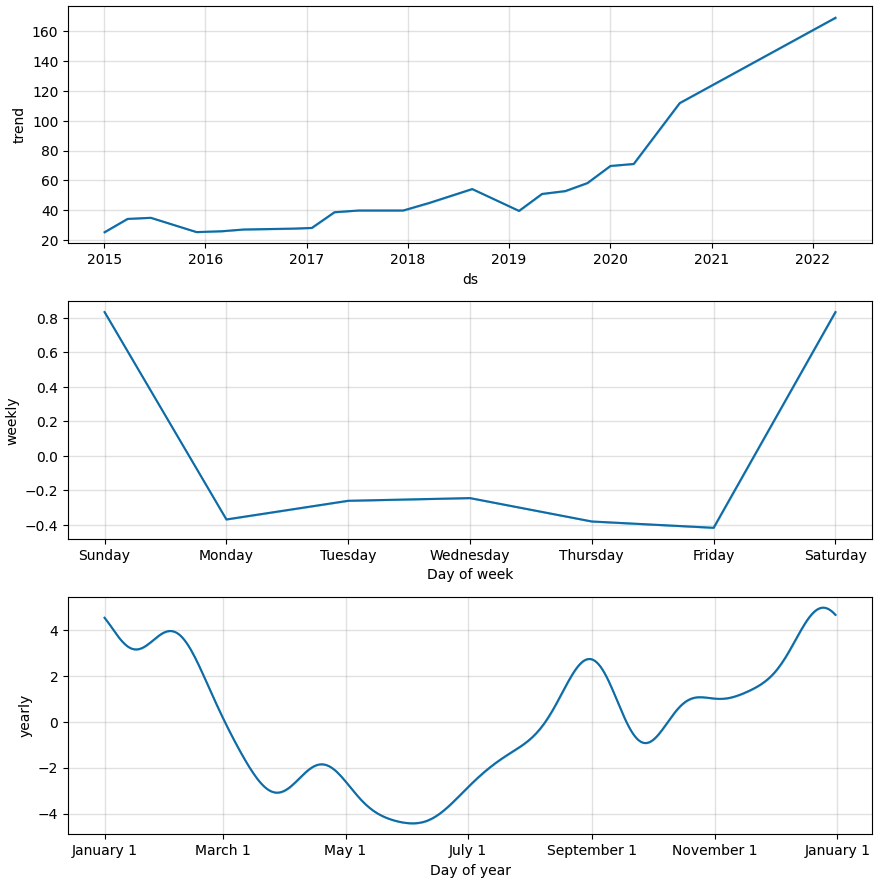
It also makes plotting the model components easy. So you can see the yearly, weekly trends
# Components
m.plot_components(forecast);
I will be forecasting this same dataset using some other forecasting models to compare results. And combining them together.
About the author
I am an Industrial Engineer utilizing the power of python to gain deeper insights in data.
I am currently learning Deep learning with TensorFlow
Comments
Join the discussionNo comments yet. Be the first to comment.


